Quotations HTML5
The Quotations menu provides functionalities for viewing and handling of stock exchange quotes. The menu options include quotes tables and baskets:
- Quotes table - opens a new gadget containing an empty quotes table. Once such a quotes table is launched, it is necessary to add securities into the table using the quotes basket editing function.
- Quotes table wizard - opens the wizard of a new quotes table where you can define, among others, the number and layout of columns, table attributes and securities;
- Create quotes basket - allows to define a set of securities to be included in a quotes basket as well as to enter the basket name.
The system menu offers the following types of quotes baskets:
- Predefined baskets (created by the Brokerage House) - these are permanent, undeletable quotes baskets that have been prepared (predefined) by the Brokerage House administrators;
- User defined baskets - these are editable quotes baskets that have been created by the account user;
You can view current stock market quotations for each basket available in the menu list by clicking on the selected basket name. This will launch a gadget containing a quotes table for securities included in the selected basket.
You can unhook this gadget into a detached window and place your quotes table on any screen or anywhere on the screen.
Quotes table
A quotes table enables the presentation of current stock market quotations for the selected quotes basket.
When a saved basket is selected from the menu, the system will display on the active desktop a gadget containing a quotes table presenting a complete range of information on the current stock market quotations of individual securities included in the table`s basket (a quotes table for any user defined basket can be also launched by choosing the Create table based on basket option).
Once a quotes table is displayed, its contents are systematically updated on the basis of stock exchange messages. The time interval between consecutive data refreshes is determined by the Brokerage House.
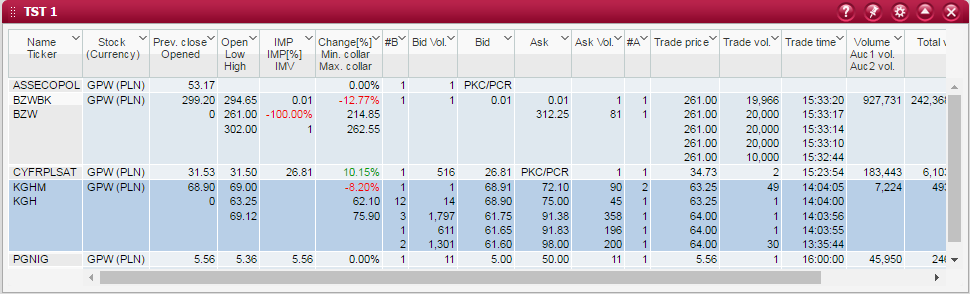
Quotes table columns
Name - the first line presents the security`s trade name. The security`s ticker is presented in the second line;
Stock / Currency - three-leteer market designation. Second row - there is trading currency;
Prev. close / Open interest - the first line presents the security`s previous closing price. The second line shows the number of open positions (open interest) which is relevant for derivative securities;
Open / Low / High - the first line presents the security`s opening price. The second line shows the minimum price at which the security was traded during the current session. The third line shows the maximum price at which the security was traded during the current session;
IMP / IMP[%] / IMV - the first line presents the security`s indicative matching price. The second line shows the percentage change of the indicative matching price in relation to the security`s previous close. The third line displays the indicative matching volume on opening. If the above-mentioned data are marked with *, this means that trading in the security has been suspended.
Change % / Low curb / High curb - the first line presents the percentage change of the security`s current price to the previous close, the column contents are coloured in green to represent a price increase or in red to represent a price decrease. The second line shows the lower curb, this is the minimum price permitted before trading in the security is suspended. The third line shows the upper curb, this is the maximum price permitted before trading in the security is suspended;
Number of buy orders - consecutive lines present the numbers of buy orders comprising the bid offer at a given price limit, in a descending order from the highest one;
Bid volume - consecutive lines present the quantities of securities in the bid offer at a given price limit, in a descending order from the highest one;
Bid - consecutive lines present the levels of bid prices offered for the security`s trading unit, in a descending order from the highest one;
Ask - consecutive lines present the levels of ask prices offered for the security`s trading unit, in an ascending order from the lowest one;
Ask volume - consecutive lines present the quantities of securities in the ask offer at a given price limit, in an ascending order from the lowest one;
Number of sell orders - consecutive lines present the numbers of sell orders comprising the ask offer at a given price limit, in an ascending order from the lowest one;
Last trade price - consecutive lines present the prices of trades conducted in the security during the current trading session, in a descending order from the latest trade;
Last trade volume - consecutive lines present the volumes of trades conducted in the security during the current trading session, in a descending order from the latest trade;
Last trade time - consecutive lines present the execution times of trades conducted in the security during the current trading session, in a descending order from the latest trade;
Volume / Auction 1 / Auction 2 - the first line presents the total volume of trading in the security, adding up the volumes of all trades conducted in the security during the current trading session. The second line presents the total volume of trading in the security, adding up the volumes of trades conducted in Auction 1 of the current trading session. The third line presents the total volume of trading in the security, adding up the volumes of trades conducted in Auction 2 of the current trading session.
Total value - the total value of all trades conducted during the current trading session;
Session phase / Security status - the first line presents information about the actual phase of session applicable for the security. The second line presents information about the security`s actual trading status;
Table lines containing the data of securities that have been updated are temporarily highlighted with a different colour.
The quotations window header displays the time of receiving the last message as well as the number of messages received from the Warsaw Stock Exchange trading system.
In addition, a quotes table can be sorted (ascending or descending) by the contents of any of its columns. In order to do so, right-click on the header of the column on which you want to sort the table.
Individual columns can be also turned off and turned on again. In order to do so, right-click on the header of the column which you want to turn off. Note: If you delete any of the table columns and save the workspace settings, but, after the next logging into the system, you decide to turn such deleted columns back on.
User can change the order of rows in the quotation table by holding down, drag and release at the desired place (drag & drop).
Note
You can place an order to sell or buy a security directly from a quotes table. In order to do so, double-click on the selected bid or ask offer and the system will open an appropriate form for placing an order that is opposite to the indicated offer.
Quotes table toolbar
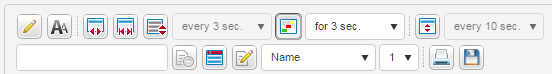
The quotes table toolbar is used to run various tool functions and options available for each quotes table. The toolbar can be launched by clicking on the toothed wheel icon designated as Settings which is located on the table`s title bar. The toolbar offers the following functions:
Change name - allows to change the table name. Upon saving, the basket will be named in accordance with this table name.
Change table font... - allows to set the type and size of the font used to display the contents of the table;
Adjust column to context - adjusts the width of all columns displayed in the table to optimally suit the current contents of individual cells. Note: If the “Adjust table to window`s width” option is enabled, then all the columns, after being adjusted to the current contents, will be additionally rescaled to match the window`s width;
Adjust table to window’s width - enables automatic rescaling of the table so that it was displayed across the whole window width. If this option is enabled, the table will be either expanded or squeezed to match the window`s width. The table columns will be scaled proportionally. If this option is enabled and the table is wider than the window area, the window will automatically display a horizontal scrollbar (similar to those used in calculation spreadsheets);
Automatic scrolling - allows to switch on/off automatic scrolling of the table contents. When this option is enabled, the table contents will be scrolled automatically if all the lines do not fit into the display area. Hence, all of the table lines will be shown consecutively (without having to manually scroll through the content). The following line scrolling modes are available:
- Automatic scrolling - off,
- Scroll whole visible area,
- Scroll by one line.
You can also determine the time interval between each scrolling step;
Highlighting - allows to switch on/off highlighting of changes in the table and set the length of highlighting time. When any information displayed in the table cell is changed (in comparison to the previously displayed data), the cell`s background will be changed accordingly. The yellow background shall denote a change in the cell`s text. Whereas, the green or red colour shall mean an increase or a decrease, respectively, in the numerical value displayed in the cell;
Automatic sorting - allows to enable table’s automatic sorting. You can set the time interval for which the sorting has to be performed;
Quickly add security - allows to add security to quotation table by typing security’s name;
Remove security - allows to remove selected security (row or rows) from the quotation table;
“Quickly add security” option always visible - when you select this option the field “Quickly add security” will be visible even when you close the toolbar;
Edit list of securities in table - opens the window in which you can modify the set of securities displayed in the table;
Securities designation - allows to select the method of designation of securities in the table;
Number of lines displayed for each security - used to set the number of lines (e.g. including offers or trades) displayed for all securities in the table. In order to change the number of lines presented for a single security, double-click on the line containing that security (except for the columns associated with bid/ask offers, in which case double-clicking will initiate registration of an order in response to the selected offer) or use the quotes table context menu that will pop up when you right-click on the selected line;
Print table - allows to print the table content;
Create basket based on table - allows to create quotation basket from the set of securities displayed in the table;
Quotes table context menu
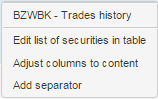
The context menu of a quotes table is intended to help you manage any windows launched for securities selected from the quotes table as well as to run special security presentation options. The table context menu can be displayed by right-clicking on a selected security. The context menu offers the following functions:
- Trades history - launches a new standard window gadget presenting a list of trades conducted in the selected security during the current session;
- Edit list of securities in table... - opens the window Table securities list editing, in which you can modify the set of securities displayed in the table;
- Adjust columns to content - adjusts the width of all columns displayed in the table to optimally suit the current contents of individual cells. Note: If the “Adjust table to window`s width” option is enabled, then all the columns, after being adjusted to the current contents, will be additionally rescaled to match the window`s width;
- Add separator - inserts an empty line, or the so-called separator, into the quotes table. Separators can be used to distinguish an important security from other securities presented in a table, in order to draw attention to such data;
Quotation table wizard
The basket wizard allows to create personalized quotation table having attributes and content according to the user’s requirements.
You can move securities between list by clicking on selected security.
Above section with lists of securities there are options that allows to set how the securities’ names should be presented (trading name, ISIN, pseudo-ISIN, ticker) and alphabetical sorting option.
To finish creating table press buton Confirm - set of securities will be updated.
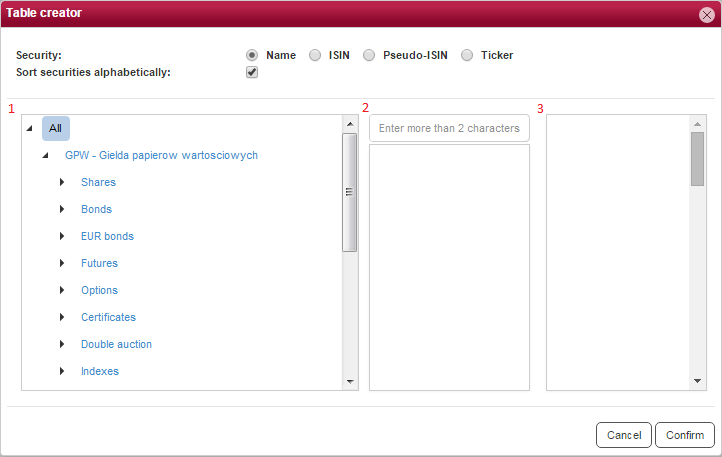
Table securities list editing
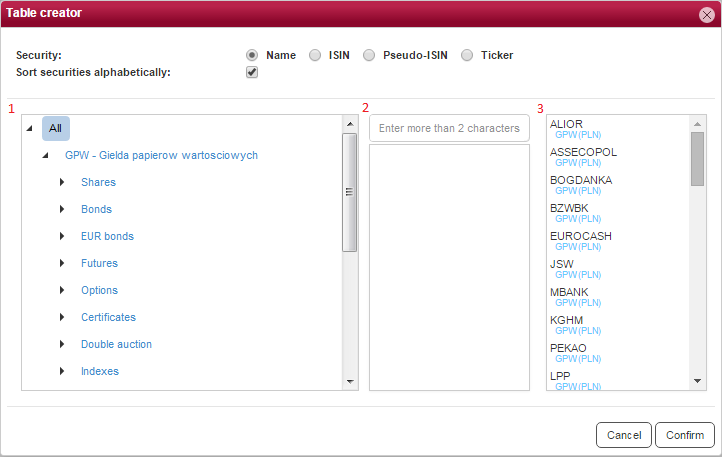
In the window for editing the list of securities, you can define the composition of your quotes table. This can be done with the help of the following three sections:
- list of Security groups – presents groups of securities in a tree-like structure, dividing securities into groups and subgroups. At first, securities are divided into type groups (e.g.: shares, futures, 2 auctions, etc.), which are subsequently divided into subgroups representing the actual groups of quoted securities (e.g.: WIG30 shares, index futures, etc.);
- list of Securities in selected subgroup / Subgroups in selected group – presents securities that belong to the earlier indicated subgroup of securities, or presents subgroups of securities that belong to the earlier indicated group of securities;
- list of Securities selected into the table – presents securities that have been selected to be displayed in your quotes table. The selection is performed by moving the available securities between the lists by clicking on their names;
Note
Securities can be quickly added to or removed from a quotes table with the help of keyboard shortcuts (without having to launch the window for editing the list of securities). In order to add a new security into your table, press the Insert or + key which will launch the security adding window. In order to remove a security from your table, select that security and press the Delete or - key.
Filters
There are two modes to filter the table content:
- In scenario where there is option All selected - data available in central field are being presented after typing the third character. List of securities is shown and narrows the list according to characters that have been entered. Order of characters is important - security’s name must begin with the characters entered).
- In scenario where there is certain market selected - data available in central field are being presented after typing the first character. List of securities has content having serch terms (not necessarily in exact order).
Creation, editing and deletion of quotes baskets
Creation of new quotes basket is performed by pressing the Create basket based on table button available in the table toolbar or by selecting the Create quotes basket option from the menu. The basket wizard lets you define the name of your newly created basket. The table name cannot contain any special characters. Once your basket is saved, it will include the same securities as were presented in the table at the time of saving.
Editing of quotes basket is performed the same way as “Creation of a new quotes basket” but after changing the set of securities in the table you have to press button Save basket, whitout changing the table name. Basket content will be changed in this case - according to table’s set of securities.
Editing of table’s set of securities is performed same way as Table securities list editing
Deletion of a quotes basket is performed by choosing the Delete basket option from the given basket drop-down menu.
Trades history
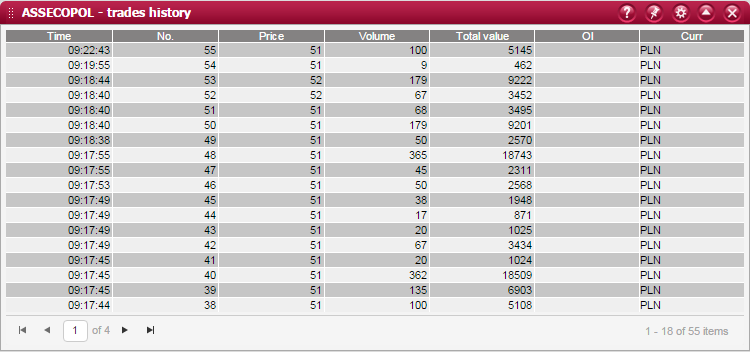
The window of Trades history can be launched from a quotes table by choosing the Trades history option from the given security`s context menu.
This window presents a list of all trades conducted in the selected security during the current session.
In case when the numer of trades exceeds maximum numer that is allowed on one page - there will be additional pages available. Switching between pages can be done by pressing arrows that are available at the control bar (you can also enter the numer of page manually).
In the right-bottom corner of the screen there is available the numer of rows on a page and total numer of rows on the whole list. The trades are sorted chronologically, from the latest to the earliest one.
Columns
Time - trade execution time,
No. - consecutive trade number during the session, where number 1 denotes the first trade conducted during the current session,
Price - trade price,
Volume - trade volume,
Value - trade value,
OI - open interest at the trade execution time,
Currency - currency in which the trade was conducted.
Charts
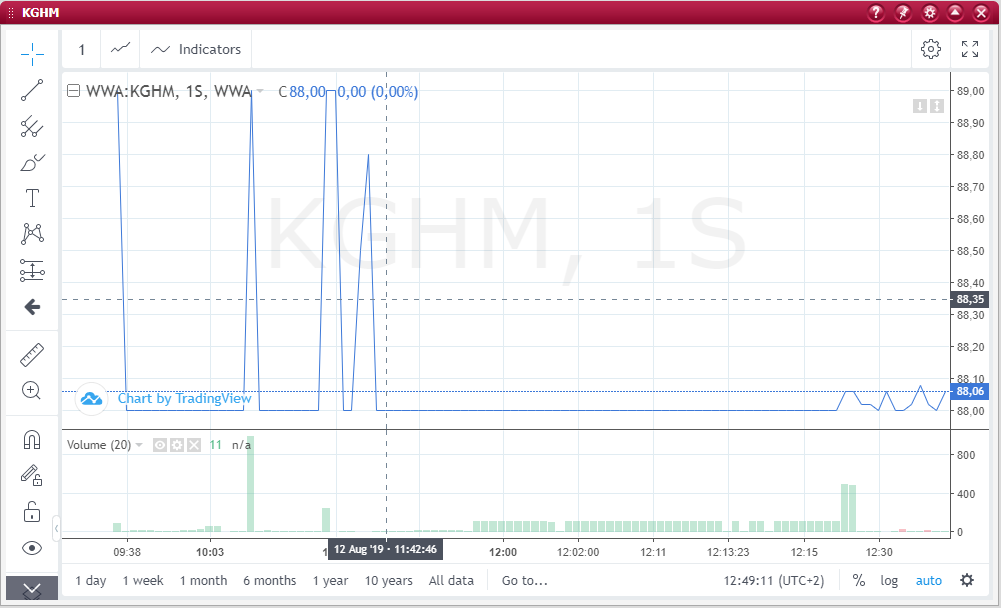
The chart window is called out from trading table by choosing the option from pop-up menu for particular instrument.
The chart window allows to present charts of: rate of exchange, volumes and drawing/erasing trend lines for particular instruments. The main part presents rate of exchange chart, the additional(lower) part shows volume.
The chart window additionally allows to change the type of the presenting chart, presented data groups interval(time) or presented data range(period).
Chart window can be opened in two modes:
- Chart - starts a standard window in new gadget with chart for a instrument pointed in table;
- Chart (depended window) - starts a standard window in new gadget with an chart for a instrument pointed in table. After changing the instrument selection in trading table for another, in the depended window the instrument will also change;
The buttons controlling the functionality of the chart window, grouped in terms of their area of operation, are placed in panels located on the edge of the window.
In the left side panel containing the Drawing Tools, there are buttons that allow you to place your own graphic elements on the chart field:
- selecting the cursor graphic
- Trend Line or Trend Line with label, other types of lines or angles
- Gunn and Fibonacci analysis tools
- geometrical areas
- texts
- graphic patterns
- outlook
- icons
- reduce/increase (limit) - only for display purposes - of the presented data (zoom)
- setting Magnet Mode
In the upper panel, there are buttons that allow:
changing the Interval (time) of data grouping - allows you to change the time range in which the data is grouped.
- 1 second
- 1 minute
- 5 minutes
- 15 minutes
- 1 hour
- 1 day
- 1 week
- 1 month
- 6 months
- 12 months
changing the Chart Type - allows you to switch the presented data to the form of a chart in one of the selected types:
- bars
- candles
- hollow candles
- Heikin Ashi
- line
- area
- base area
selecting Indicators. Select an indicator from the available list of indicators or indexes. His chart will be placed on the course chart or a rectangular panel containing the indicator chart will be created. One or several indicators can be selected, indicator graphs can be removed from the main graph at any time.
setting Properties - allows you to change the presentation style of the selected chart type (colour, scale, background). It also allows you to specify the source of prices presented in the chart.
setting Fullscreen Mode.
In the bottom panel there are buttons enabling:
change in the Scope of presented data - allows to indicate for what period of time data is downloaded and presented. The following data ranges are available:
- 1 day
- 1 week
- 1 month
- 6 months
- 1 year
- 10 years
- full range of available data(ALL)
The button Go to ... - allows you to indicate on the graph a point showing data from the selected day (depending on the interval you can also enter the time).
chart scale control